Energy monitoring
Sustainability
Energy monitoring
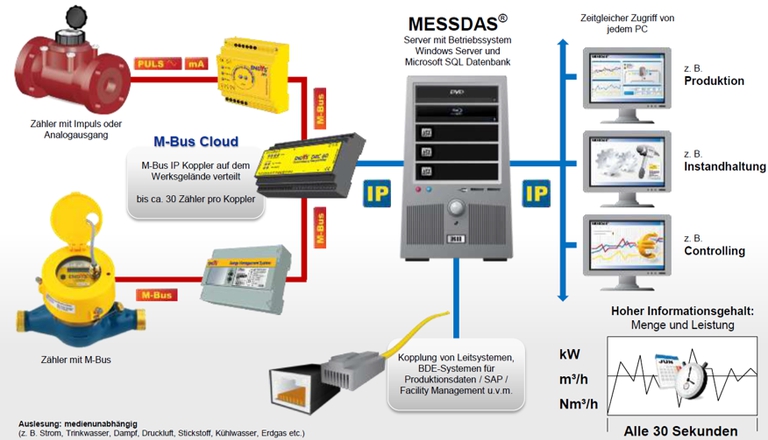
The flow of energy at DESY is recorded in a central database. The aim of this monitoring is to be able to retrieve and use the energy data at short notice. This means that all meters must be automatically readable. At regular intervals, the database retrieves the data from the meters and stores it. The data can then be processed using the Messdas© software.

Data traffic Messdas© software. On the left the networked meters, on the right the analysis and evaluation options.
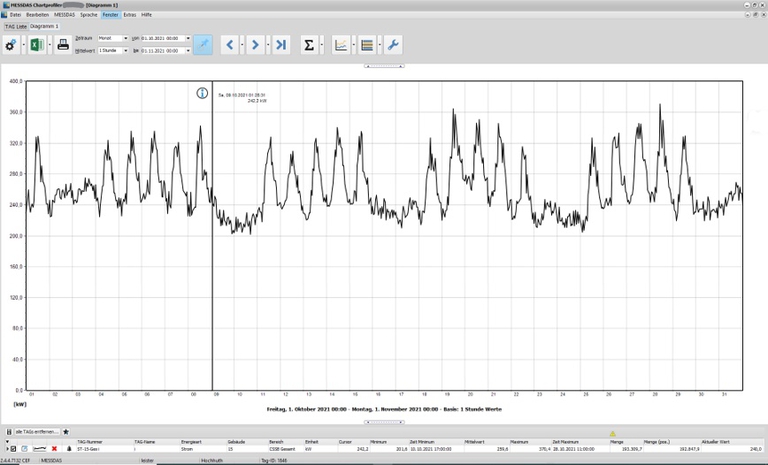
The Messdas© system offers many functions and tools for energy monitoring which are needed in order to process the measured data. Measured data can first be displayed and analysed using the chart profiler.

Energy measurement of a meter October 2021 in KWh. The structure of the working weeks is clearly visible.
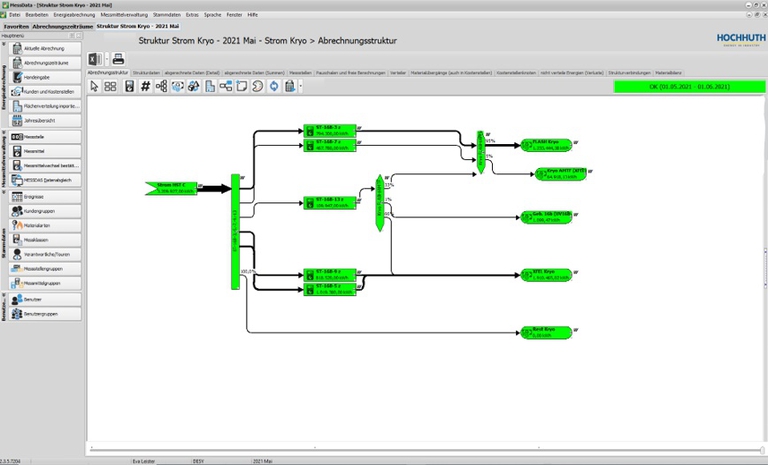
Automatic reports are generated by the reporting function. Flowcharts can be used to visualise the data, e.g. in the form of a Sankey diagram.
The system can also be used to manage the measuring equipment used. The allocation of energy consumption to cost centers is used for accounting purposes.
Since 2013, around 900 automatic meters have already been installed or replaced. Some meters are still read by hand and current requirements indicate that another 1,000 meters will have to be added.
Energy monitoring at DESY has continued to develop steadily in recent years. The first efforts in energy management and monitoring were made in 2013. The Messdas© software was not introduced until 2018. In 2013, there were far fewer meters and all of them had to be read by hand. The results were then used for accounting and forecasting, making use of Excel.
In 2015, a database was created for the meter readings, and reading the meters was centralised. This gave the Energy Management Department more options for analysing and evaluating the data.


